GitClear First-Party Research & Studies
This section of the site is designed as a home specifically for the first-party research that GitClear periodically conducts. If you want to read more about developer measurement and code metrics in general, check out our Research & Learning Center.
-
Git Commit Count Percentile Stats, Annual Days Active from 878,592 Dev-years
This research analyzed 878,592 dev-years and observed that the median developer averaging at least one commit per work day will contribute 417 commits per year, over the course of 156 active days.
-
30% Less is More: Code Review Strategies That Cut Pull Request Size
This research analyzed 12,638 pull requests and observed a reduction of 22-31% in code lines to review by better interpreting code operations. 50 review participants suggest that review quality remains high.
-
Coding on Copilot: 2023 Data Suggests Downward Pressure on Code Quality
Analysis of 153 million lines of code authored between 2020 and 2023 suggest that the proportion of "copy/pasted" code is increasing while moved code decreases.
-
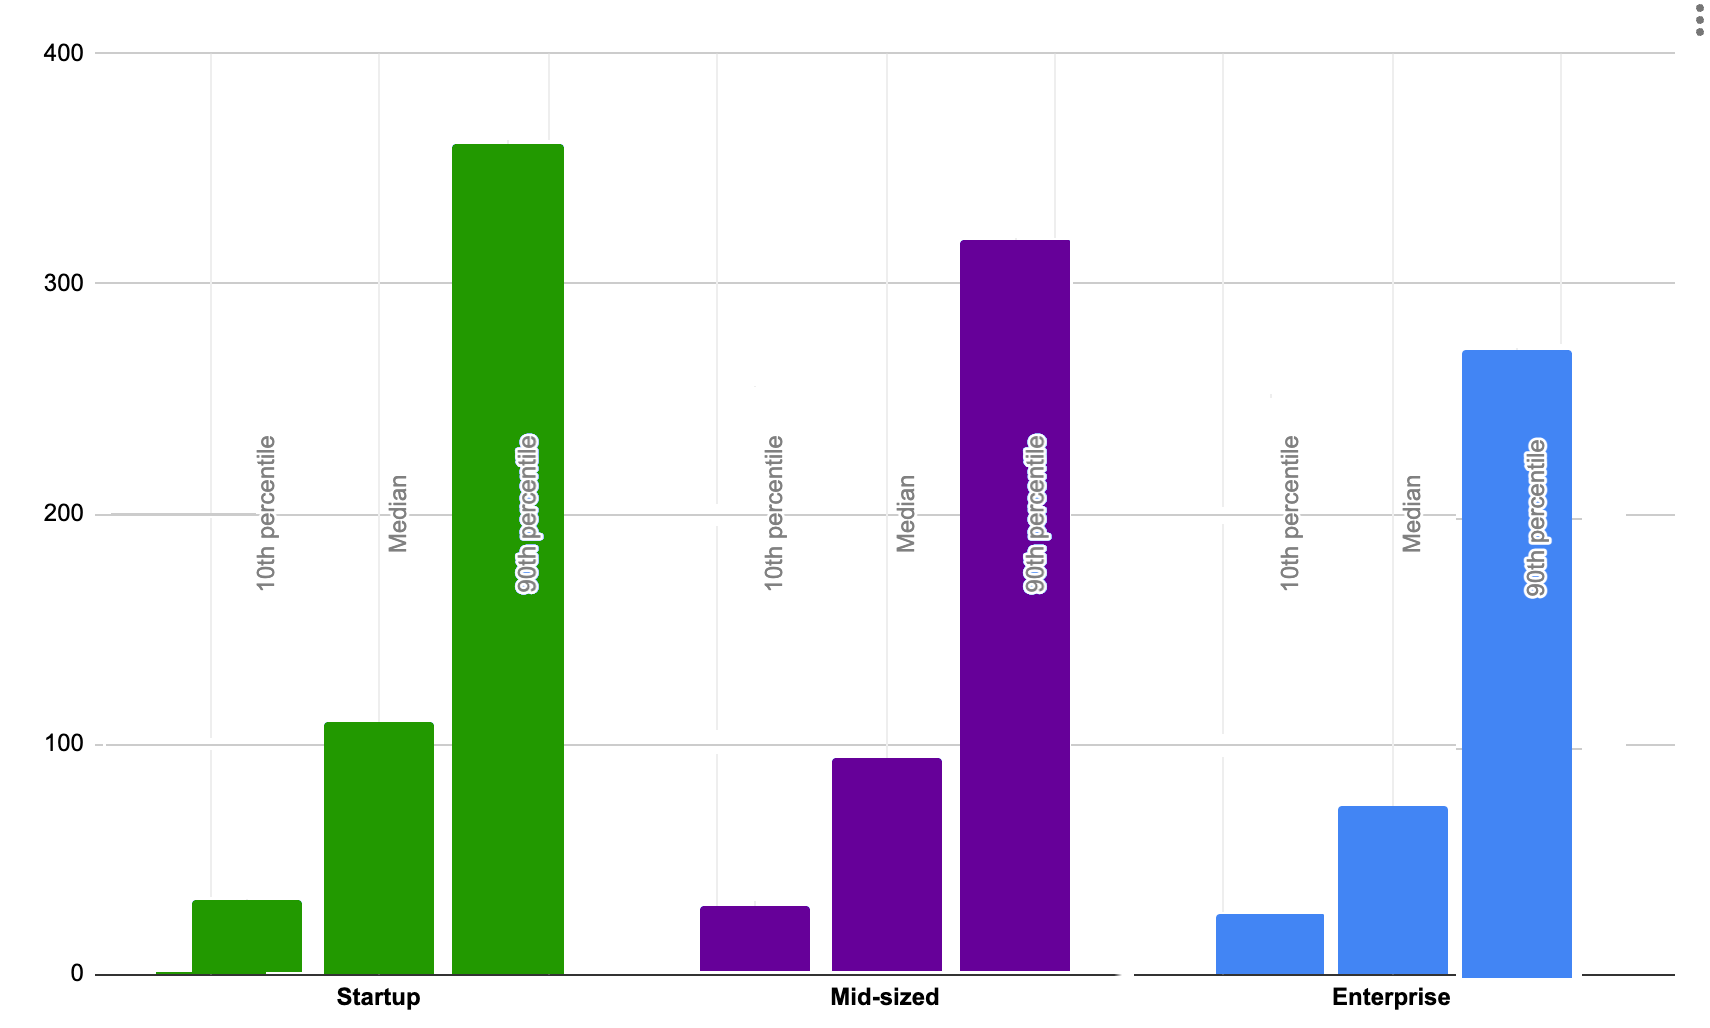
Diff Delta in Context: Benchmarks for 10k or 1m Diff Delta, and How Does Company Size Influence Velocity?
This research presents example websites and products, and how much Diff Delta was required to build them.
-
Measuring Code Activity for Data-Driven Decisions
The most comprehensive guide to measuring software coding activity for data-driven decision makers.
-
Diff Delta, Commits, Code Lines: A Story Point Correlation Study
Peer-reviewed research suggests Diff Delta has higher correlation with "software effort" than other git metrics.
-
Lines of Code Breakdown: A Compositional Analysis
For teams that use "lines of code" as a metric, what are they measuring? Breaking down 10 million code line changes.


